Ah yes. It’s that time of year again. Time to throw off the shackles of old man winter, toss our winter coats to the side, roll down our car windows and welcome spring with open arms. Of course, we are now subject to listening to others music choices, which tend to be loud and rather awful in such close proximity to a college campus. But I digress! Spring is here for good, (Our good friends at Capital Weather Gang agree) and if you feel like it’s arrived a bit earlier than usual, well you’d be right.
We will get into the expected warmth for March a bit later. But, seeing as we’ve collectively declared winer dead, lets take a look back at some month by month stats for the Winter of 2015/16.
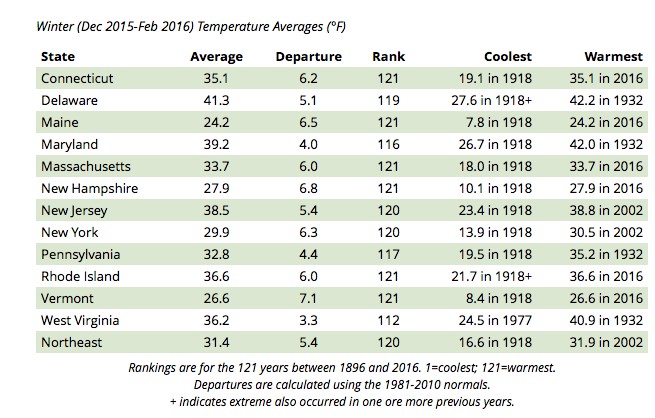
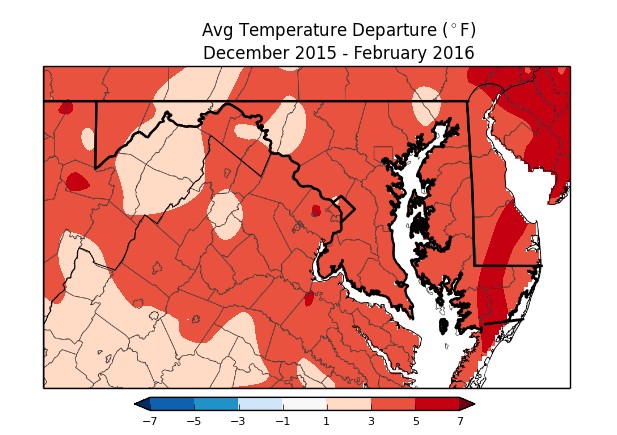
Clearly, the numbers above indicate a warmer than average winter. Every state in the northeast experienced positive temperature departures from December through February. A closer look below shows some expected variance in temperature departures locally, but the conclusion remains the same. Winter 2015/16 was indeed a warm one.
Precipitation metrics are much more nuanced. This of course is directly related to the non normal distribution nature of precipitation. Winter precipitation can fall as rain, snow, ice, cats or sleet. Ok, maybe not cats. But the extreme variation in type makes it hard to quantify. Not to mention the wide range of precipitation totals that occur within any weather event.
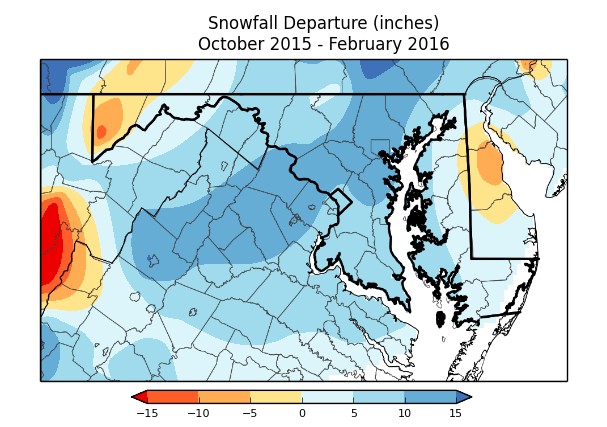
With that said, the mid-Atlantic will end up with a higher than normal snowfall rate from Winter 2015/16. Naturally, the vast majority of this fell during one major storm (January 22nd-24th). We really saw no significant snowfall outside of this one event, but we will still end up with a positive snowfall departure number. You can see why this metric may not be the best indicator for a seasonal wrap up discussion.
Ok, so Winter 2015/16 was warm, not really snowy (despite one storm). How about that buzz term that everyone likes to reference this year? El Niño!
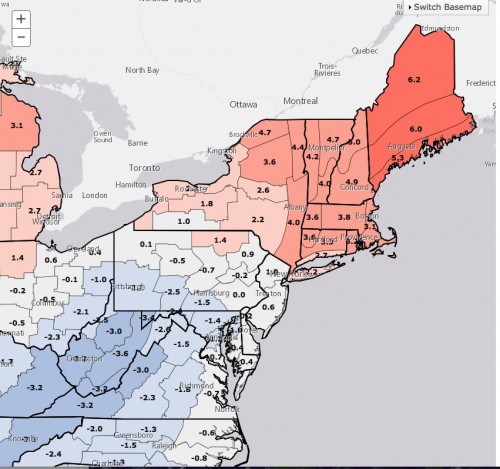
Comparisons to past El Niño years shows a somewhat muddled picture. December temperature departures were quite high across the Northeast compared to the last 6 El Niño episodes. But January temperature departures ended up a little blow normal for the mid-Atlantic, again likely influenced by our late January blizzard.
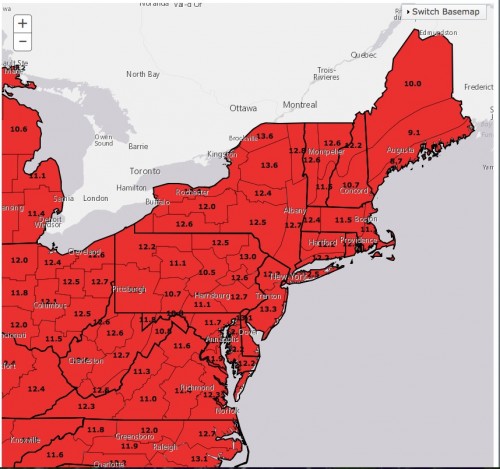
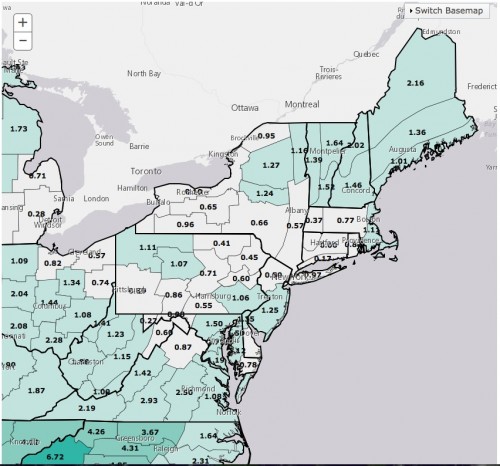
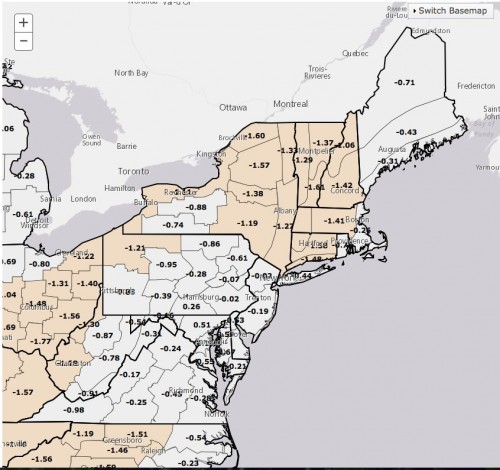
Interestingly enough, the precipitation departures for El Niño years had an opposite correlation, with December being wetter than average and January drier than average.
The strength of the current El Nino is second only to 1997 , having likely peaked in December. However, from a preliminary statistical nature, it remains somewhat unclear as to the influence El Niño has had on our Winter of 2015/2016.It is the nature of such large scale climate phenomenon to have an delayed effect on sensible weather patterns around the world. As such, an El Niño that appears to have just peaked two months ago will very likely be a strong influence on our spring weather pattern.
So, enough dwelling in the past! Let’s take a quick look into our glorious warm future. Given the expected pattern for the next 3 to 4 weeks, I would be surprised to see the area have a day where the high temperature doesn’t at least reach 50 degrees. Should this be the case, we would set a new record for the earliest (March 5th 2016) date for a sub 50 degree maximum daily temperature. The last such record occurred in March of 2012, which if your memory needs some refreshing, check the image below. That month was quite hot. 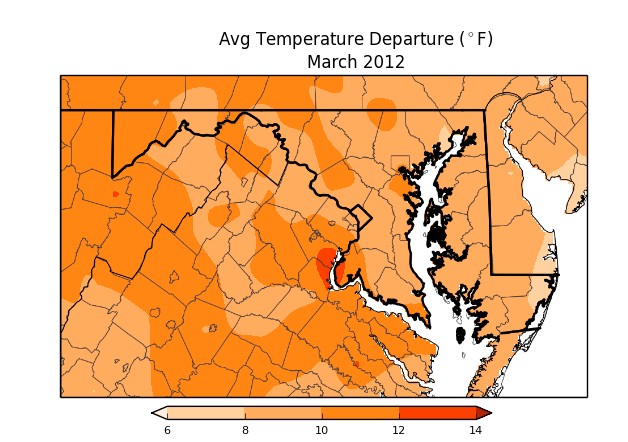
Will March 2016 eclipse these temperature anomalies? Time will most certainly tell. In the meantime, enjoy the spoils of a perhaps record warm start to Spring 2016. And by all means, play your somewhat obnoxious music as loud as you want.

