
Picture a cat trying to grab at a ball of yarn and constantly missing – that’s what this winter felt like with respect to snow for us here in the DMV. The closer in to Washington, DC you are, the harder it was to come by meaningful snow.
Here's all the snow that's fallen this winter through last Thursday. Even with last Wednesday's snow, quite the #SnowHole over DC. See a great set of maps showing winter snowfall over the Lower 48 from @postgraphics here: https://t.co/QZdBGq71gS pic.twitter.com/f5SysSxNtO
— Capital Weather Gang (@capitalweather) March 26, 2018
We managed to surpass 80 degrees on February 21st at Reagan Airport, the earliest time in history that’s ever happened, and then meteorological spring on March 1st hit. Not until the last couple weeks during Spring Break did we have the most significant impacts from a winter storm affect College Park. Makes sense, right?
Now that it’s finally spring, we will take a look back at the winter as a whole and check our previous winter seasonal forecast.
Let’s take a look at the snowfall:
It seemed that every time a forecast alluded to the atmosphere misbehaving and dumping snow on us, the snowfall managed to dodge us and slam our friends to the north.
Here’s what you all thought:
We are preparing a winter outlook and would like to include how much snow YOU think will fall this winter at the University of Maryland. ❄️
— UMD Weather (@UMD_Weather) November 6, 2017
And here’s what we at UMD Weather thought:
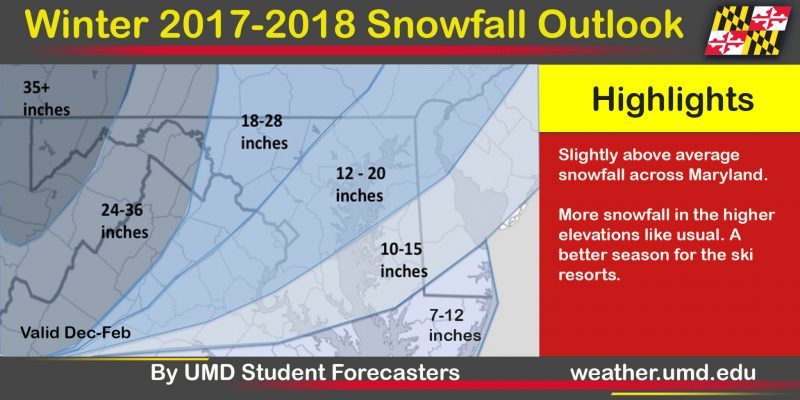
UMD Weather’s forecasted amount of seasonal snowfall for Maryland.
Reagan National Airport (DCA), BWI, and Dulles Aiport were able to muster out 7.8, 15.4, and 11.9 inches of powder, respectively. Given our initial forecast map, we went more aggressive with our snowfall forecast, given the presence of a La Niña event (more explained in the analysis section). At the same time, those are all paltry amounts compared to our averages. Reagan, BWI, and Dulles average 15.4, 20.1, and 22.0 inches, respectively, so it was considered a down winter for snow lovers. Snowfall estimates are always tricky in that a winter can be quiet, and all we need is one blockbuster storm to push us over our average.
Interestingly enough, our area received more snowfall in December and March than January and February, which was particularly upsetting for our nearby ski resorts. A lack of snowfall in the midst of Old Man Winter, combined with many warm stretches, made a true winter feel out of reach for the DMV.

Seasonal snowfall over the lower 48 United States. The majority of Maryland received around 1 ft of snow. (via NOHRSC/NOAA)
How did we do with temperatures?
I’m grumbling at the cool weather we’ve experienced as of recent, but I’m also looking forward to the 80s possible towards the end of the week. UMD Weather predicted:
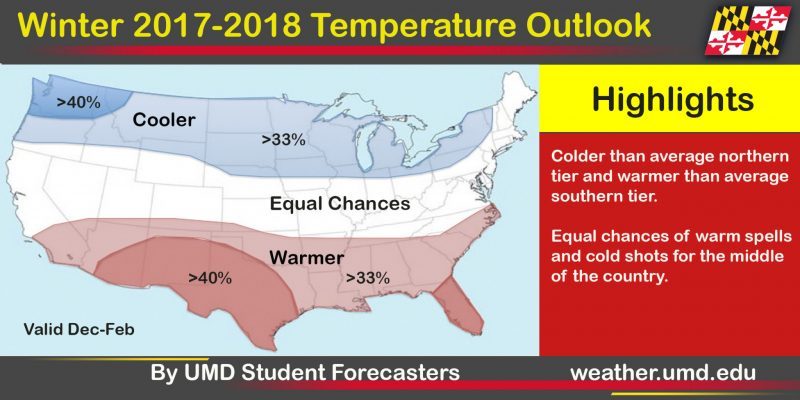
UMD Weather’s nationwide forecasted temperature departures from average for our winter.
It was a pretty safe bet to go average for this winter, considering that for the most part, that was the case for College Park, looking at the winter as a whole. From the eye test (below), we may have been a degree or two below average, although, our temperatures proved to be quite volatile over the course of the winter. We fluctuated from subzero wind chills on New Years Eve to a whopping 82 degrees on February 21st, with everything in between.
Our national outlook had some skill, particularly in the southwest, southeast, and northern Great Plains of the U.S. More often than not, the northern half of the country was feeling the bitter cold, and combined with being below average, it only adds insult to injury (below).
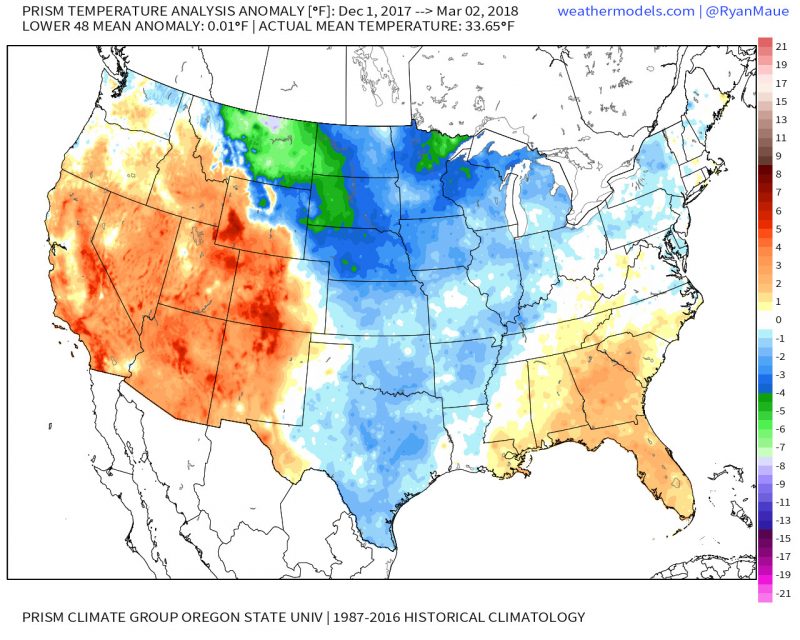
Temperature departures from normal over the winter (December through February). Cool colors (blue, green) indicate below average and warm colors (red, orange) indicate above average. (via Wx Graphics)
Alright, so what actually happened this winter?
Many winter weather forecasters, like ourselves, look at whether there will be an El Niño/La Niña event to make long term predictions. But, the truth is that many factors affect whether or not we’ll get enough snow to close school, so that you can put off studying for your calculus exam.
What is El Niño, you ask? Well, these are defined by warmer than average ocean temperatures in the eastern tropical Pacific, whereas a La Niña is the opposite pattern – below average ocean temperatures. Believe it or not, this can have a profound impact on the weather in your backyard.
Looking at the El Niño/La Niña index is convenient for forecasting because we can successfully predict this months in advance, unlike many of the other predictors available at our fingertips for seasonal forecasts.
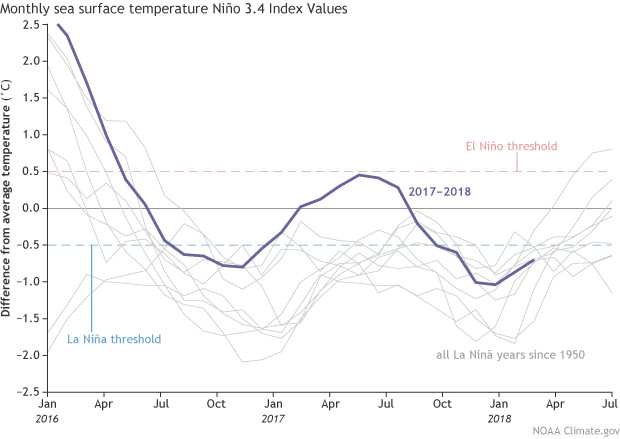
El Niño/La Niña index values over the past 2 years. The solid blue line indicates the recorded value. (via CPC/NOAA)
The past couple months have undoubtedly been a La Niña, which impacts us by altering the jet stream as well as the placement of low pressures in the U.S. Typically, we see the jet stream more active over the northern U.S., leading to wetter weather and cooler temperatures over the north. Simultaneously, the jet stream is less active over the south, yielding warmer and drier weather.

Typical wintertime pattern with a La Niña showing active jet stream, giving the northern U.S. more active weather patterns over the course of a winter. (via CPC/NOAA)
For our area, we are somewhat in the middle – putting us right at average. Many storms this winter grazed us to our north and pummeled cities to our north, which is nothing out of the ordinary for this pattern.
As important as La Niña is, it’s not everything that goes into a long term forecast. We have other oscillations in the atmosphere to blame, as well as variability and randomness in such a chaotic system like the atmosphere.
Feature photo courtesy of Pixabay.