
Its May 17th in the Washington DC area and its raining, again. If you feel like it’s basically been raining for the entire month, you’re not that far off from reality. Much has already been written about the depression excessive rain can bring . And I am sure most of you have heard about the record setting rain streak followed up by record low temperatures Monday morning. Yes, there is no doubt that it has been a miserable May. But, rather than wallowing in the cool and damp reality, lets investigate why we are can’t seem to shake this weather pattern.
First, some visuals to confirm that our misery is not a distortion of the truth.
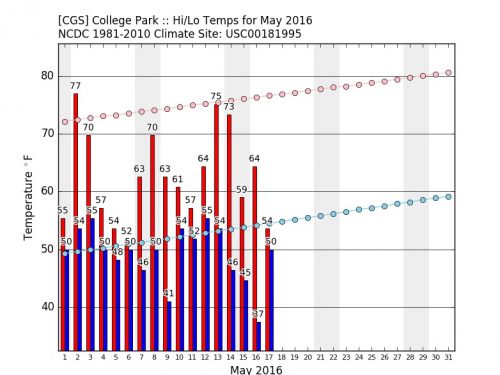
High/Low temps for College Park with climatology (average) temps plotted in red and blue lines.

Frequency (%) of days with cloud cover at 12pm in College Park for May 2016
The last visual is perhaps the most depressing. It has been anomalously cloudy throughout the entire mid-Atlantic for all of May. Clouds of course do two things: Bring precipitation but more importantly, reduce daytime temperatures. That can be confirmed with the first visual, where we see only 2 out of the 17 days in May so far have had high temperatures above climatology. Conversely, several days have had low temperatures below climatology.
Ok, so we now have some visual confirmation that we are not crazy. So why has May 2016 been this way? To answer this, follow me into the lovely world of meteorology! (Yes, I know that sounded very nerdy)
When we in the weather world want to analyze recent patterns, we like to look at composites. Think of this as an average position of some particular feature over some particular time. In this case, we want to look at the average height anomalies at 500mb (about 18,000ft) from May 1st to May 15th. Now, we use anomalies because we want to compare this current trend to recent historical trends from the same time period. And we look at the “height” as an indication of whats going on at the surface.
There are several great sources online that go into better detail for why we look at 500mb heights, but for brevity reasons, I will include them at the end to use at your own disposal. Lets just summarize by saying lower heights (indicated by blue) corresponds to what we call a “trough” and more inclement weather. Higher heights (indicated by red) correspond to a “ridge” and more pleasant weather.
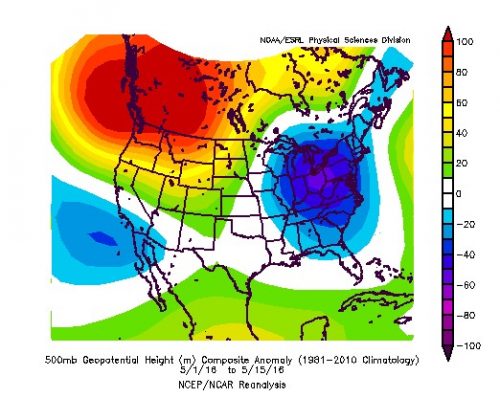
Average departure from normal in 500mb heights from May 1-15th
Taking all that we just learned (or hopefully learned) we can clearly see a pattern that has been persistent for the entire month of May. The entire eastern half of the country is stuck in an elongated trough, bringing reinforcing shots of cool air, cloudy conditions and rain. Meanwhile, the western half of the continent is baking under a continuous ridge of high pressure. These hot and dry conditions are the driving force behind the devastating Ft. McMurray wild fire in Alberta.
So you are probably saying to yourselves, “ok Greg but WHY have we been stuck in a persistent trough”. If you asked this question, then you’d make for a good scientist! Wanting to know why things constantly happen is hallmark of science. It’s also the hallmark of being a little brother. Just ask my older sisters.
In reality, there really is no clear reason why we have been stuck in such a miserable pattern. When we start to look at extended time frames for patterns (beyond 2 weeks), we need to consider atmospheric variabilities that happen on the same time scale. In this case, it makes sense to look at the rapidly weakening El Nino. A change in El Nino strength will almost undoubtably have an effect on the driving weather patterns over the US. Combine that with the natural chaos that occurs in spring time (cold air retreating/warm air building) and we have a recipe for anomalous weather conditions. Simply put, the atmosphere is in the midst of an identity crisis, happening at an already naturally chaotic time (Spring) and we here in the mid Atlantic are unfortunately bearing the brunt of the effects.
But alas! There is good news afoot.

Ensemble average position of 500mb heights for May 24th
Long term trends (like the image above) indicate that we will return to more normal warm and sunny conditions around May 24th. Notice the little wedge of higher heights near the mid Atlantic? That’s good news for the area! And somewhat bad news for those of us that hate humidity (like yours truly). But even I am getting sick of this rain and I would gladly take a few days of uncomfortable sweating.
So the take away message friends is to hold tight. This week will remain unsettled, with periods of rain and clouds. But the end of the misery is near. Next week looks like the trend breaker.
Links
Learn more about why and how we use 500mb heights